About Pixel Philly
This page was built as an experiment for a talk I gave on "Storytelling With Maps" at Rowan University on Nov. 12, 2026. It's built from data on every building, street tree and piece of land cover in the city of Philadelphia. It is imperfect. It is incomplete. It should only be used for entertainment purposes. The goal was to see how far I could get ahead of my talk using public data. This slideshow has more details on how and why I put it together. I ran out of time, so Google Gemini was ultimately used for one piece of this: creating the example images that taught the AI model its illustration style. If I can address that in the future to make this a true public data project, I will. The rest of the sourcing is listed below.
This is a largely vibe-coded project, using Claude Code, designed to show attendees how I am experimenting with LLMs to extend my skills and knowledge. I have 15 years of foundational knowledge on GIS and data. It was emphasized to attendees that AI is not a replacement for foundational knowledge. The code for this project is here: https://www.github.com/sstirling/pixel-philly.
How the map was made
- Building footprints, heights, trees, water and parks from the public sources below were assembled into a 3D model of the city.
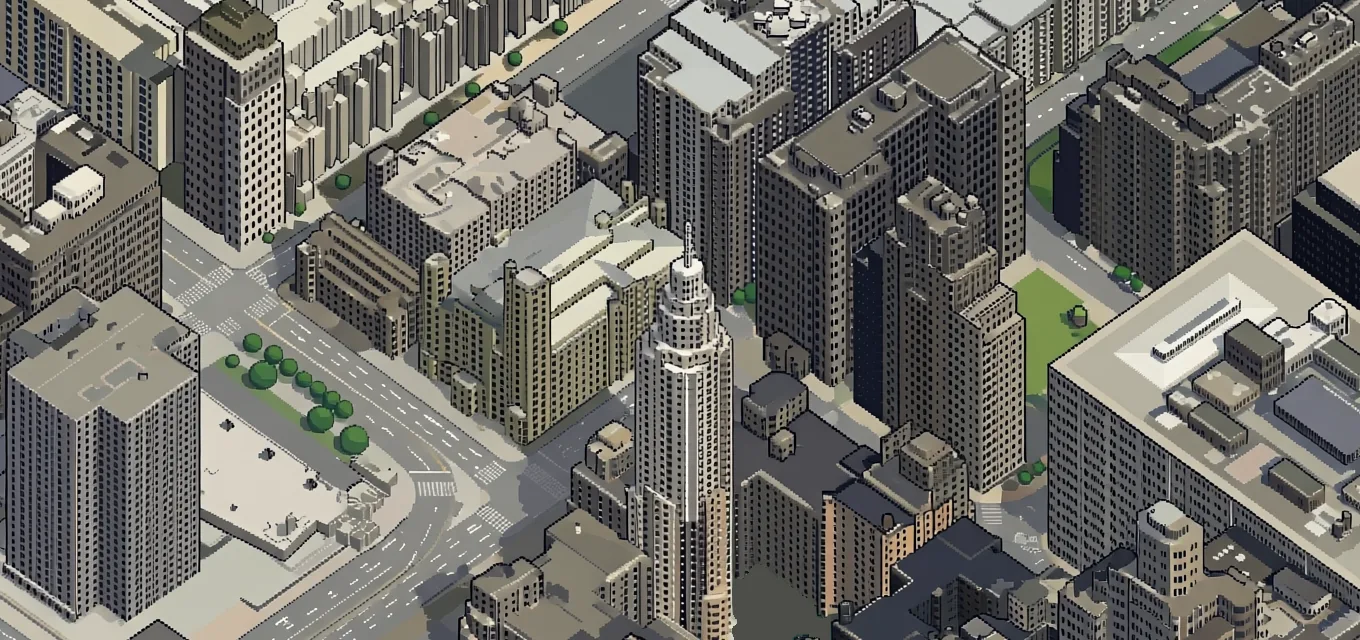
- The model was draped with the City's 2024 aerial photos and rendered from a fixed isometric camera, in about 3,300 square tiles.
- An open-source AI image model redrew each render as pixel art. Neighboring tiles were drawn together so streets and buildings line up across their edges.
- Automated checks, plus review against the aerial photos, removed water the AI invented, corrected winter-brown lawns and fixed buildings drawn from bad height records.
What to keep in mind
- It's an illustration, not a survey. The AI can invent, simplify or misplace details. Errors caught in review were fixed; others remain.
- Data dates differ. The aerial photos were taken in March 2024 and the 3D heights come from 2022 LiDAR. Building outlines, trees and other City layers were downloaded in October and November 2026.
- Woods and trees are stylized. Street trees come from the City's tree inventory. Woods are drawn as tree shapes placed using LiDAR, not as individual surveyed trees.
- No personal information. Building styles use only property-record fields that describe the building (its type, size and age). No owner names, sale records, mailing addresses, tax data or property-condition ratings were used.
- Address search uses the City's address service and drops a pin at street level.
Data sources
City of Philadelphia
- Building footprintsWith the City's height estimates. Department of Licenses and Inspections.
- 2024 aerial imagery, 3-inch resolutionVia PASDA. The photo layer, and the colors of roofs and ground.
- 2022 LiDAR point cloudVia PASDA. Building shapes and heights, woods and other structures.
- Property recordsOffice of Property Assessment, building-description fields only, matched to buildings through Water Department parcels.
- Street centerlines and railroad linesStreets Department; street-facing walls, highways and rail.
- City limitsWhere the map stops.
- Tree inventory, park properties and swimming poolsPhiladelphia Parks & Recreation.
- Hydrographic featuresPhiladelphia Water Department.
Federal
- National Hydrography DatasetU.S. Geological Survey. Rivers and creeks.
- National Wetlands InventoryU.S. Fish and Wildlife Service.
- Park unit boundariesNational Park Service. Independence National Historical Park.
Other
- Market-Frankford Line routeSEPTA.
- Building colors and materials, golf course features© OpenStreetMap contributors, available under the Open Database License.
AI models and software
- Drawing modelQwen-Image-Edit-2511 (Qwen team, Alibaba; Apache 2.0), sped up with Qwen-Image-Edit-2511-Lightning (lightx2v; Apache 2.0).
- Illustration styleA custom style add-on (a LoRA) trained for this project on Philadelphia images generated with Google Gemini 3 Pro Image. Every tile on the map was drawn with it.
- Softwarethree.js (3D rendering), OpenSeadragon (map viewer), Modal (GPUs). Code written with Claude Code (Anthropic).
Inspiration
tiny.london and isometric.nyc.
Map version v18, frozen Nov. 9, 2026.